Software Development Performance Metrics After AI Adoption
Rising throughput can mask quality problems and wasted work that dashboards don't measure.
PR throughput is the number everyone reaches for first, and it's not fake. Teams with high AI adoption merge more pull requests per engineer than teams with none, and cycle times are down too. But throughput measures pace, not whether the thing you shipped was worth shipping or will still be standing in three months.
Here's the position worth taking up front: throughput isn't just an incomplete number, it's actively misleading. Teams that lead with it are optimizing for the easiest thing to measure, not the thing that actually matters.
Two problems hide inside a rising throughput number:
- Volume inflation. AI can produce PRs faster than any human can review them carefully. The bottleneck moves from writing code to reviewing it, invisible to anyone tracking merges alone.
- Churn concealment. A PR that merges fast and then gets rewritten or reverted a few days later still counts as "throughput." It also counts as wasted work, and nothing on the dashboard flags that.
Code churn, the rate at which merged code gets modified or thrown out soon after, has climbed noticeably since AI tools became standard. AI-coauthored code tends to show more issues than human-written code from the same period. A team celebrating a big jump in PRs merged might be building technical debt faster than it ships anything durable. Churn and throughput both go up on the same graph, in the same green color, looking like the same kind of good news.
The productivity paradox that vendor dashboards don't show
A randomized controlled trial run by METR, published on arXiv in July 2025, found that experienced developers working in mature codebases were slower with AI tools turned on, not faster, even though those same developers predicted beforehand that AI would speed them up. Trained professionals, measuring their own output in real time, got the direction of the effect wrong.
A few things explain that gap:
- Generation feels instant, so it feels fast. But checking the AI's work, fixing what it got wrong, and re-prompting when it misses the point all take time that developers rarely credit back to the tool.
- Context matters a lot. The METR study looked at experienced developers on mature, complicated codebases, close to the hardest setting for AI to help in a straightforward way.
- New features, boilerplate-heavy work, and tasks with a clear, narrow scope are where AI tends to actually save time. Deep debugging inside a system the developer already knows cold is a different animal entirely.
"Developers feel faster" should carry almost no weight in a vendor pitch deck. The one study that actually checked feeling against reality found the feeling was wrong. Sentiment surveys are no substitute for controlled measurement, and controlled measurement only works if you know what kind of task you're looking at. Lump everything into one productivity score and you hide the exact variation that explains why AI helps in one workflow and drags in another.
How code quality metrics reveal what throughput obscures
Quality is the piece missing from almost every AI adoption dashboard, and it's where some of the biggest effects are landing.
The data points in two directions at once, depending on what teams do around the tool:
- Teams that expand AI use to code review, not just code generation, tend to see better quality outcomes. The process change matters as much as the tool itself.
- Teams that adopted AI generation without adequately adapting their review or quality gates have seen defect rates rise.
AI-coauthored PRs also show roughly 1.7 times more issues than human-written ones. That's a sign the review bar needs to move rather than stay where it was set for a codebase nobody's writing by hand anymore. Most teams treat AI adoption as a generation problem to solve, when the actual bottleneck is review. You can buy every developer a coding assistant and still ship more bugs, because the checkpoint meant to catch them never got rebuilt.
A few quality signals worth building into the dashboard:
- Code churn rate. What share of merged code gets changed or reverted within two weeks? Pre-AI baselines sat well below where most teams are running now. A rising number here is a direct quality warning.
- AI vs. human churn ratio. If AI-written code churns at more than roughly 1.5 times the rate of human-written code, review hasn't kept pace with generation speed.
- Defect escape rate, split by whether the code was AI-assisted, so you can see if bugs are clustering.
- Review depth. Are reviewers actually catching problems in AI-generated PRs, or approving them faster because the code reads clean on the surface?
The point isn't to distrust AI output by default. It's to find out whether the review process is built for the mix of code coming through it now, versus the mix it was designed for a few years ago. Most review processes weren't rebuilt; they were just asked to move faster, and that shows up in the defect numbers.
Flow state and developer experience as lagging indicators of sustainable productivity
Developer experience surveys aren't new. What's new is what they need to ask. The old question was "are developers happy with their tools." The question that matters now is: are developers spending time on the work they find meaningful, and is AI helping with that or getting in the way?
Context switching is one of the clearest costs AI can move in either direction:
- When AI sits inside tools developers already use (the IDE, the terminal, GitHub, Slack), it cuts down on switching between tasks.
- When AI needs its own separate window or workflow, it adds a layer instead of removing one.
Worth tracking on the flow side:
- Time spent in deep, focused work versus time spent on coordination and switching. This can often be pulled straight from calendar and activity data a team already has.
- How often coding sessions get interrupted.
- Time spent on work developers themselves call low-value versus high-value, to check whether AI is actually shifting that balance.
Retention and stickiness matter here too. Tools that genuinely improve work tend to sustain higher retention. Tools that don't deliver real value tend to see usage fall off over time. Looking at tool retention by team, month over month, tells that story faster than a satisfaction survey: a survey captures what people say, retention captures what they actually do when nobody's asking.
Flow remains one of the more consistent signals of whether things actually ship.
Autonomy as a measurable dimension, not a binary capability
Most teams measure what AI produces. Almost none measure how much human effort went into getting that output. Autonomy isn't a yes-or-no switch, it's a spectrum, and treating it as a switch is exactly how a team ends up unable to explain why the same tool "works" on one project and fails on another.
On one end: a developer writes a prompt, gets a chunk of code back, and pastes it in by hand. On the other end: an agent reads a ticket, plans the work, writes the code, runs tests, and opens a PR with little human involvement in between. Most teams' AI-assisted work sits somewhere in the middle, and where it sits, and whether that position is moving, is one of the more telling signals of how mature a team's AI setup actually is.
Some concrete ways to measure it:
- Human interventions per agent task. How many times does a developer have to re-prompt, correct, or restart the agent inside a single task?
- Completion rate without mid-task input. What percentage of agent tasks reach a reviewable state without the developer stepping in?
- Scope of delegated work. Is the team only handing over boilerplate, or also feature work, test writing, refactors, and CI failure triage?
Teams that track autonomy over time can see whether their prompting and setup are actually improving, instead of just assuming AI is "getting better" in the abstract because the vendor said so.
There's a cost dimension too, and it's the one most likely to blindside a budget. Token and API usage can add up fast at scale, and autonomy without cost tracking is how teams end up surprised by a bill. Cost per completed task, broken out by task type, tells you where autonomy is actually paying off and where it's just expensive.
One thing that makes autonomy metrics useful instead of just descriptive: letting the developer decide, task by task, how much independence to hand the agent. That choice is what turns "the agent did X% of the work" from a trivia stat into something a team can actually act on.
Why ROI calculations tend to undercount the real cost and overcount the real gain
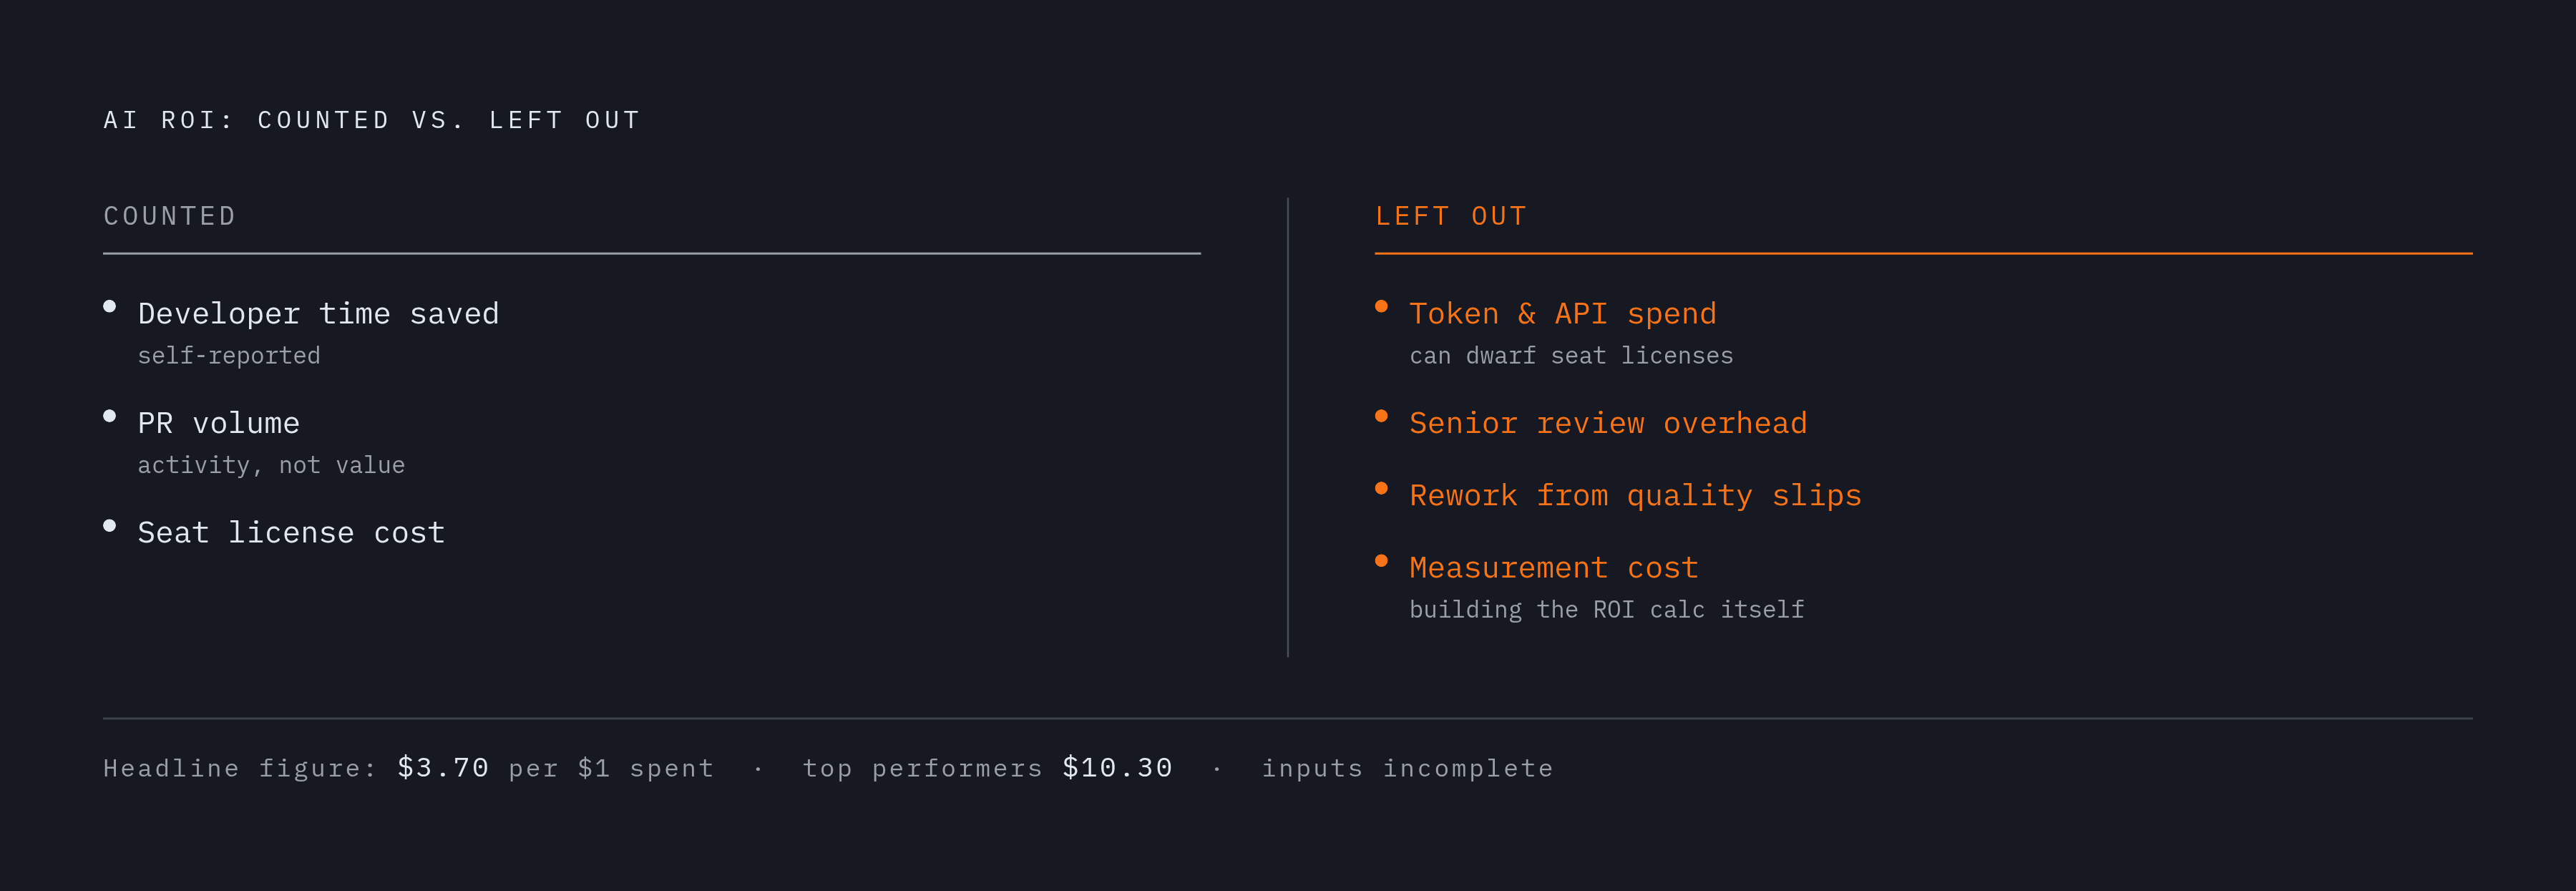
The headline ROI numbers on AI investment look great. Fullview AI Statistics 2025 put average returns at $3.70 for every dollar spent, with top performers hitting $10.30 per dollar. Numbers like that deserve more scrutiny, not less: most of them would fail to survive an audit, because the inputs feeding them are incomplete by design.
Look at what feeds those calculations. It's usually the same three incomplete inputs: developer time saved (self-reported, so see the METR problem above), PR volume (an activity count, not a value count), and seat license cost (the most visible line item, and often the smallest one).
Costs that get left out:
- Token and API spend at scale. In real enterprise deployments, this can dwarf what's spent on seat licenses, yet it often never even shows up on the "AI spend" line.
- Review overhead. As AI generates more code faster, senior engineers spend more hours reviewing it. That time costs money, and it stays absent from the tool's budget line.
- Rework from quality slips. If churn is rising, someone is spending engineering hours fixing what got merged too fast. That's a real cost of adoption, and it's rarely attributed back to AI.
- Building the measurement itself. Dashboards and tracking take engineering time too.
And gains get inflated in the other direction:
- Vendor-reported individual speed gains don't automatically turn into team-level delivery speed, unless review and CI/CD move faster too.
- Faster drafting only shortens the overall delivery timeline if testing and deployment keep pace. Otherwise the bottleneck just moved somewhere else.
A trustworthy ROI number has to measure the whole pipeline: review hours, rework hours, and token bills nobody flagged as "AI cost," not just the moment code gets generated.
What a rebuilt measurement framework looks like in practice
A framework that actually fits AI-assisted development needs three layers, and each one answers a different question.
Output quality layer. Is the code getting shipped better or worse than before?
- Churn rate, split by whether the code was AI-assisted or human-written
- Defect escape rate, same split
- Review thoroughness: time spent per PR, comment density
Flow and experience layer. Are developers spending their time on the right things?
- Self-reported time in high-value versus low-value work, checked quarterly rather than once a year
- How often work gets interrupted
- Tool retention, as a signal of what's actually useful versus what's just mandated
Autonomy progression layer. Is the AI doing more over time, and doing it well?
- Human interventions per agent task
- What categories of work are successfully being delegated
- Cost per completed task, tracked over time
PR throughput and velocity stay in this setup, but they stop being the headline and become context: one input among several, not the scoreboard.
Ideally, this framework gets built before rollout. If that ship has sailed, build it now. A baseline matters more than how polished the dashboard looks.
Segmenting by task type isn't optional. Aggregate numbers hide exactly the variation that explains why AI speeds up one kind of work and slows down another, the lesson sitting inside the METR finding: average everything together and the real story disappears.
Agentic tools that work inside a developer's existing environment (the IDE, the terminal, GitHub, Slack) tend to produce better data than tools that live somewhere separate, simply because the work stays visible instead of moving off to a tool nobody's tracking.
Careful measurement is what lets a team push AI further with real confidence, and make the case to everyone else in the building that the gains on the table are grounded, not just numbers that happened to go up.