Software Engineering Metrics for AI-Augmented Teams
Old metrics fall apart when AI writes more code than humans do.

Software engineering metrics were built to measure people. Lines of code, commit frequency, story points per sprint: every one of these assumes a human sat down, thought through a problem, and typed the answer. That assumption doesn't hold anymore. AI-generated code makes up 41% of all code written in 2026, and the old metrics don't seem to know what to do with that fact. So what replaces them? That's the whole question this piece is trying to answer.
What actually changed when agents entered the workflow
Start with a distinction that matters more than it sounds like it should: autocomplete versus agents.
Autocomplete finishes your sentence. Maybe the next line, maybe the next block. You're still driving the car.
Agents are a different animal entirely. They plan multi-step tasks, run shell commands, read and write files across a codebase, check their own output, and open pull requests without being asked twice. They don't wait for you to type the next line. They go do the work and come back when it's done.
That shift happened fast. 13.1% of professional developers now use AI agents in their workflow, stacked on top of whatever autocomplete they already had running. Agents show up across most of the development cycle now, reading requirements, writing code, writing tests, wiring up CI/CD, opening the PR. GitHub's Copilot agent mode generates pull requests at scale, and sitting in a dashboard, those PRs can look almost identical to ones a person wrote by hand.
And here's the part that really breaks things: one engineer might be running multiple agents at once, on different pieces of the same problem. So a commit log with one developer's name on it might really be one person directing several automated workers. Most metrics in use today assume one developer maps to one unit of work. Once that mapping falls apart, the question has to change. It's no longer "how much did this person produce." It's "how well did this person direct and check the work that got produced."
The productivity paradox: why individual gains don't automatically become team gains
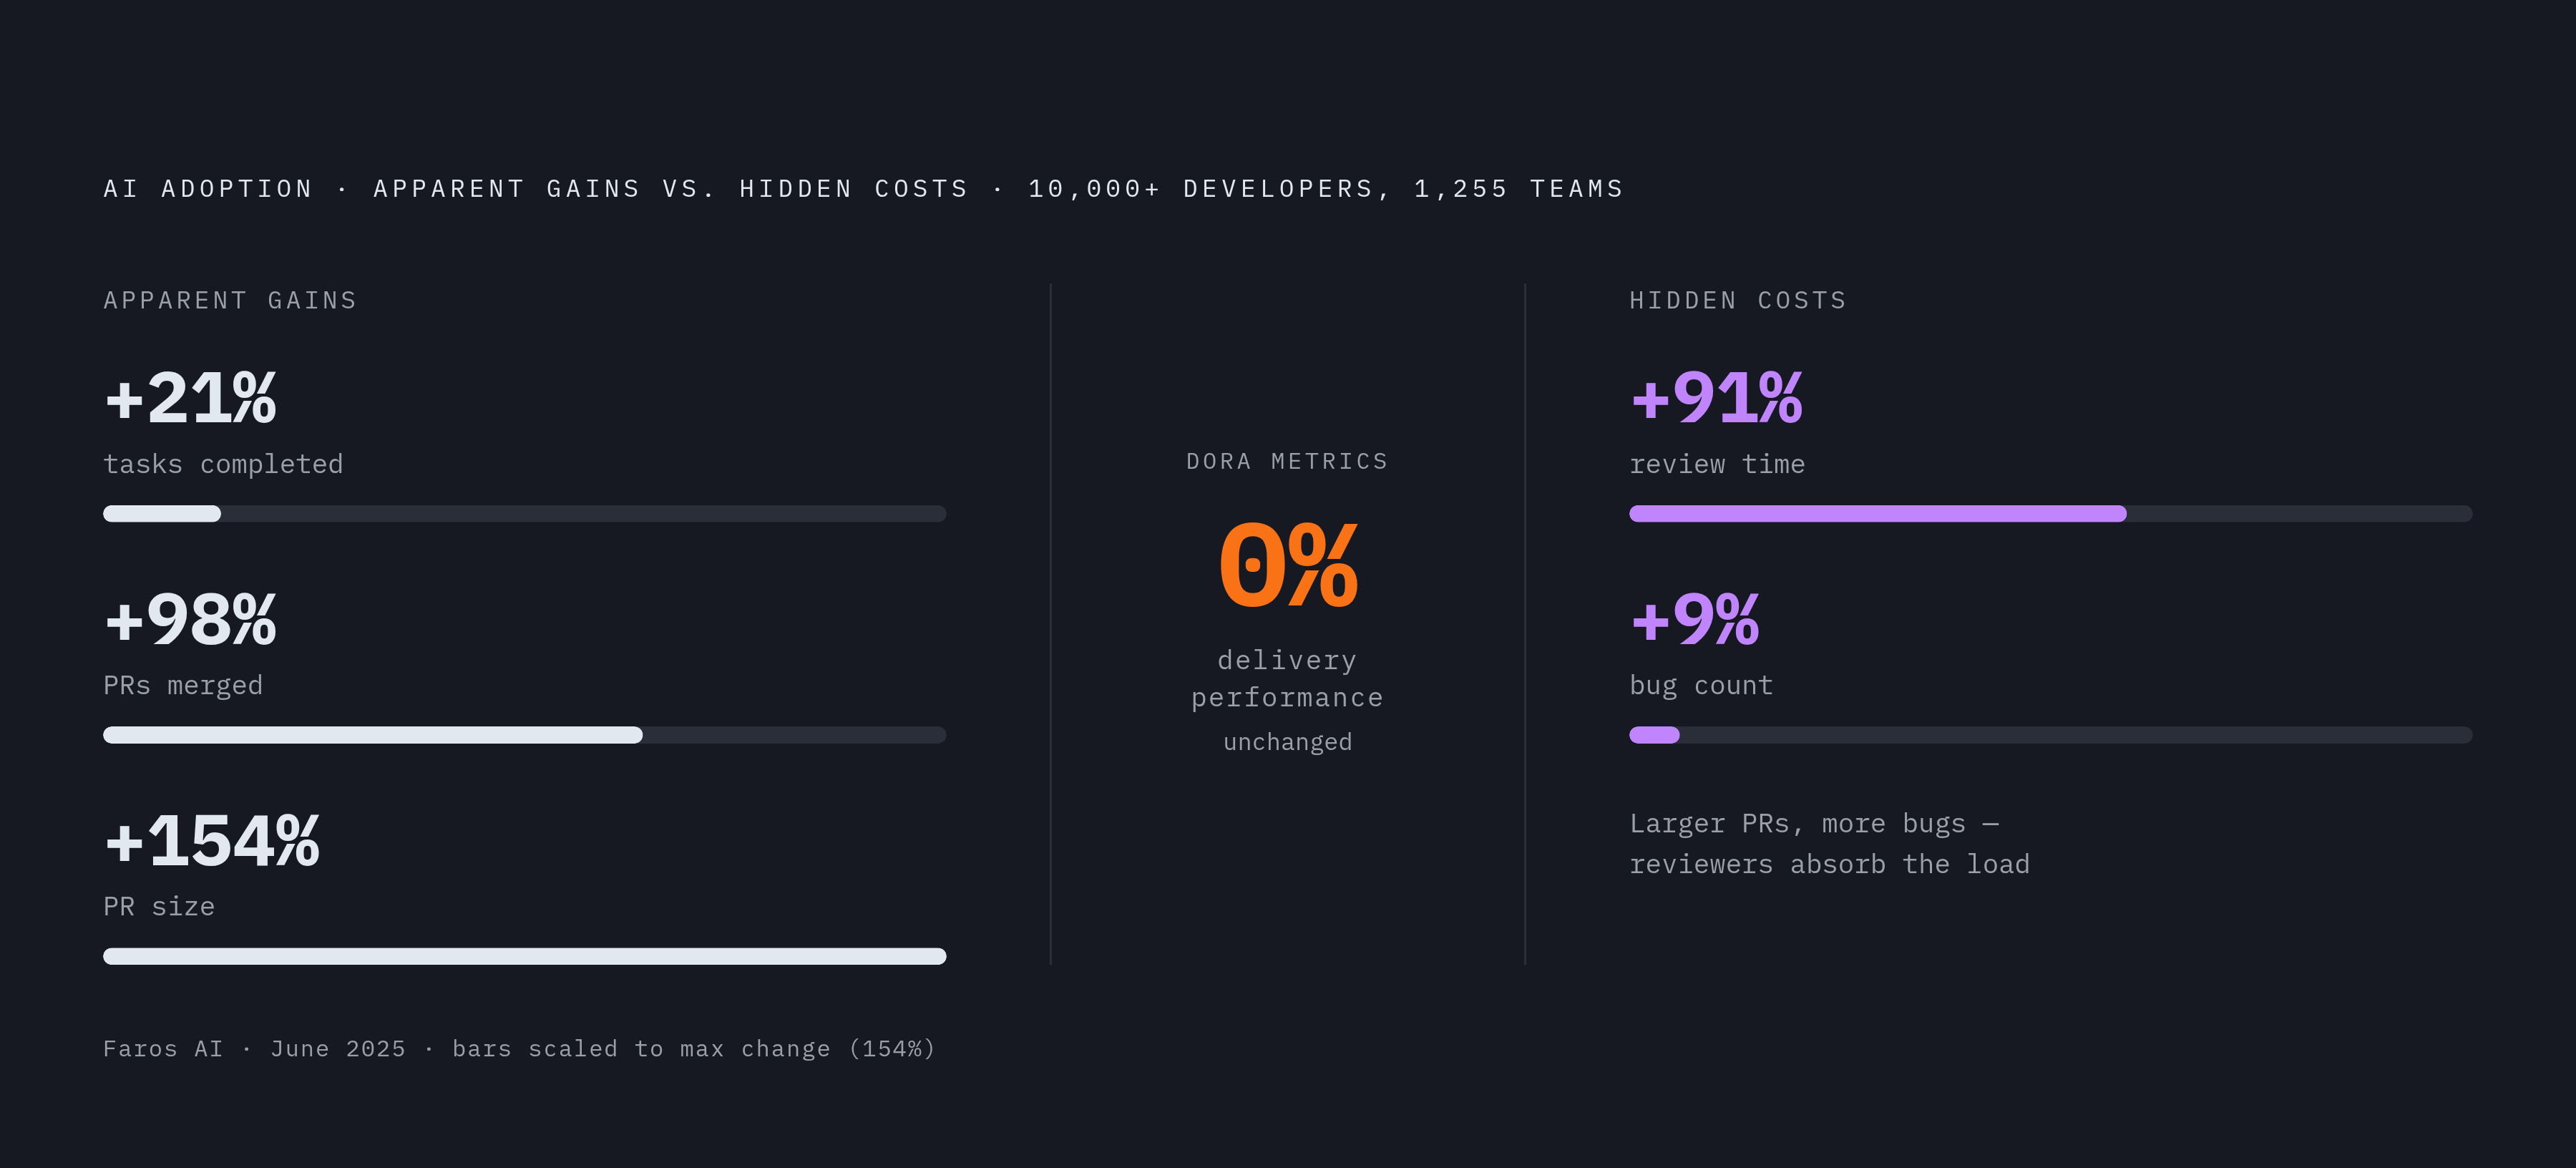
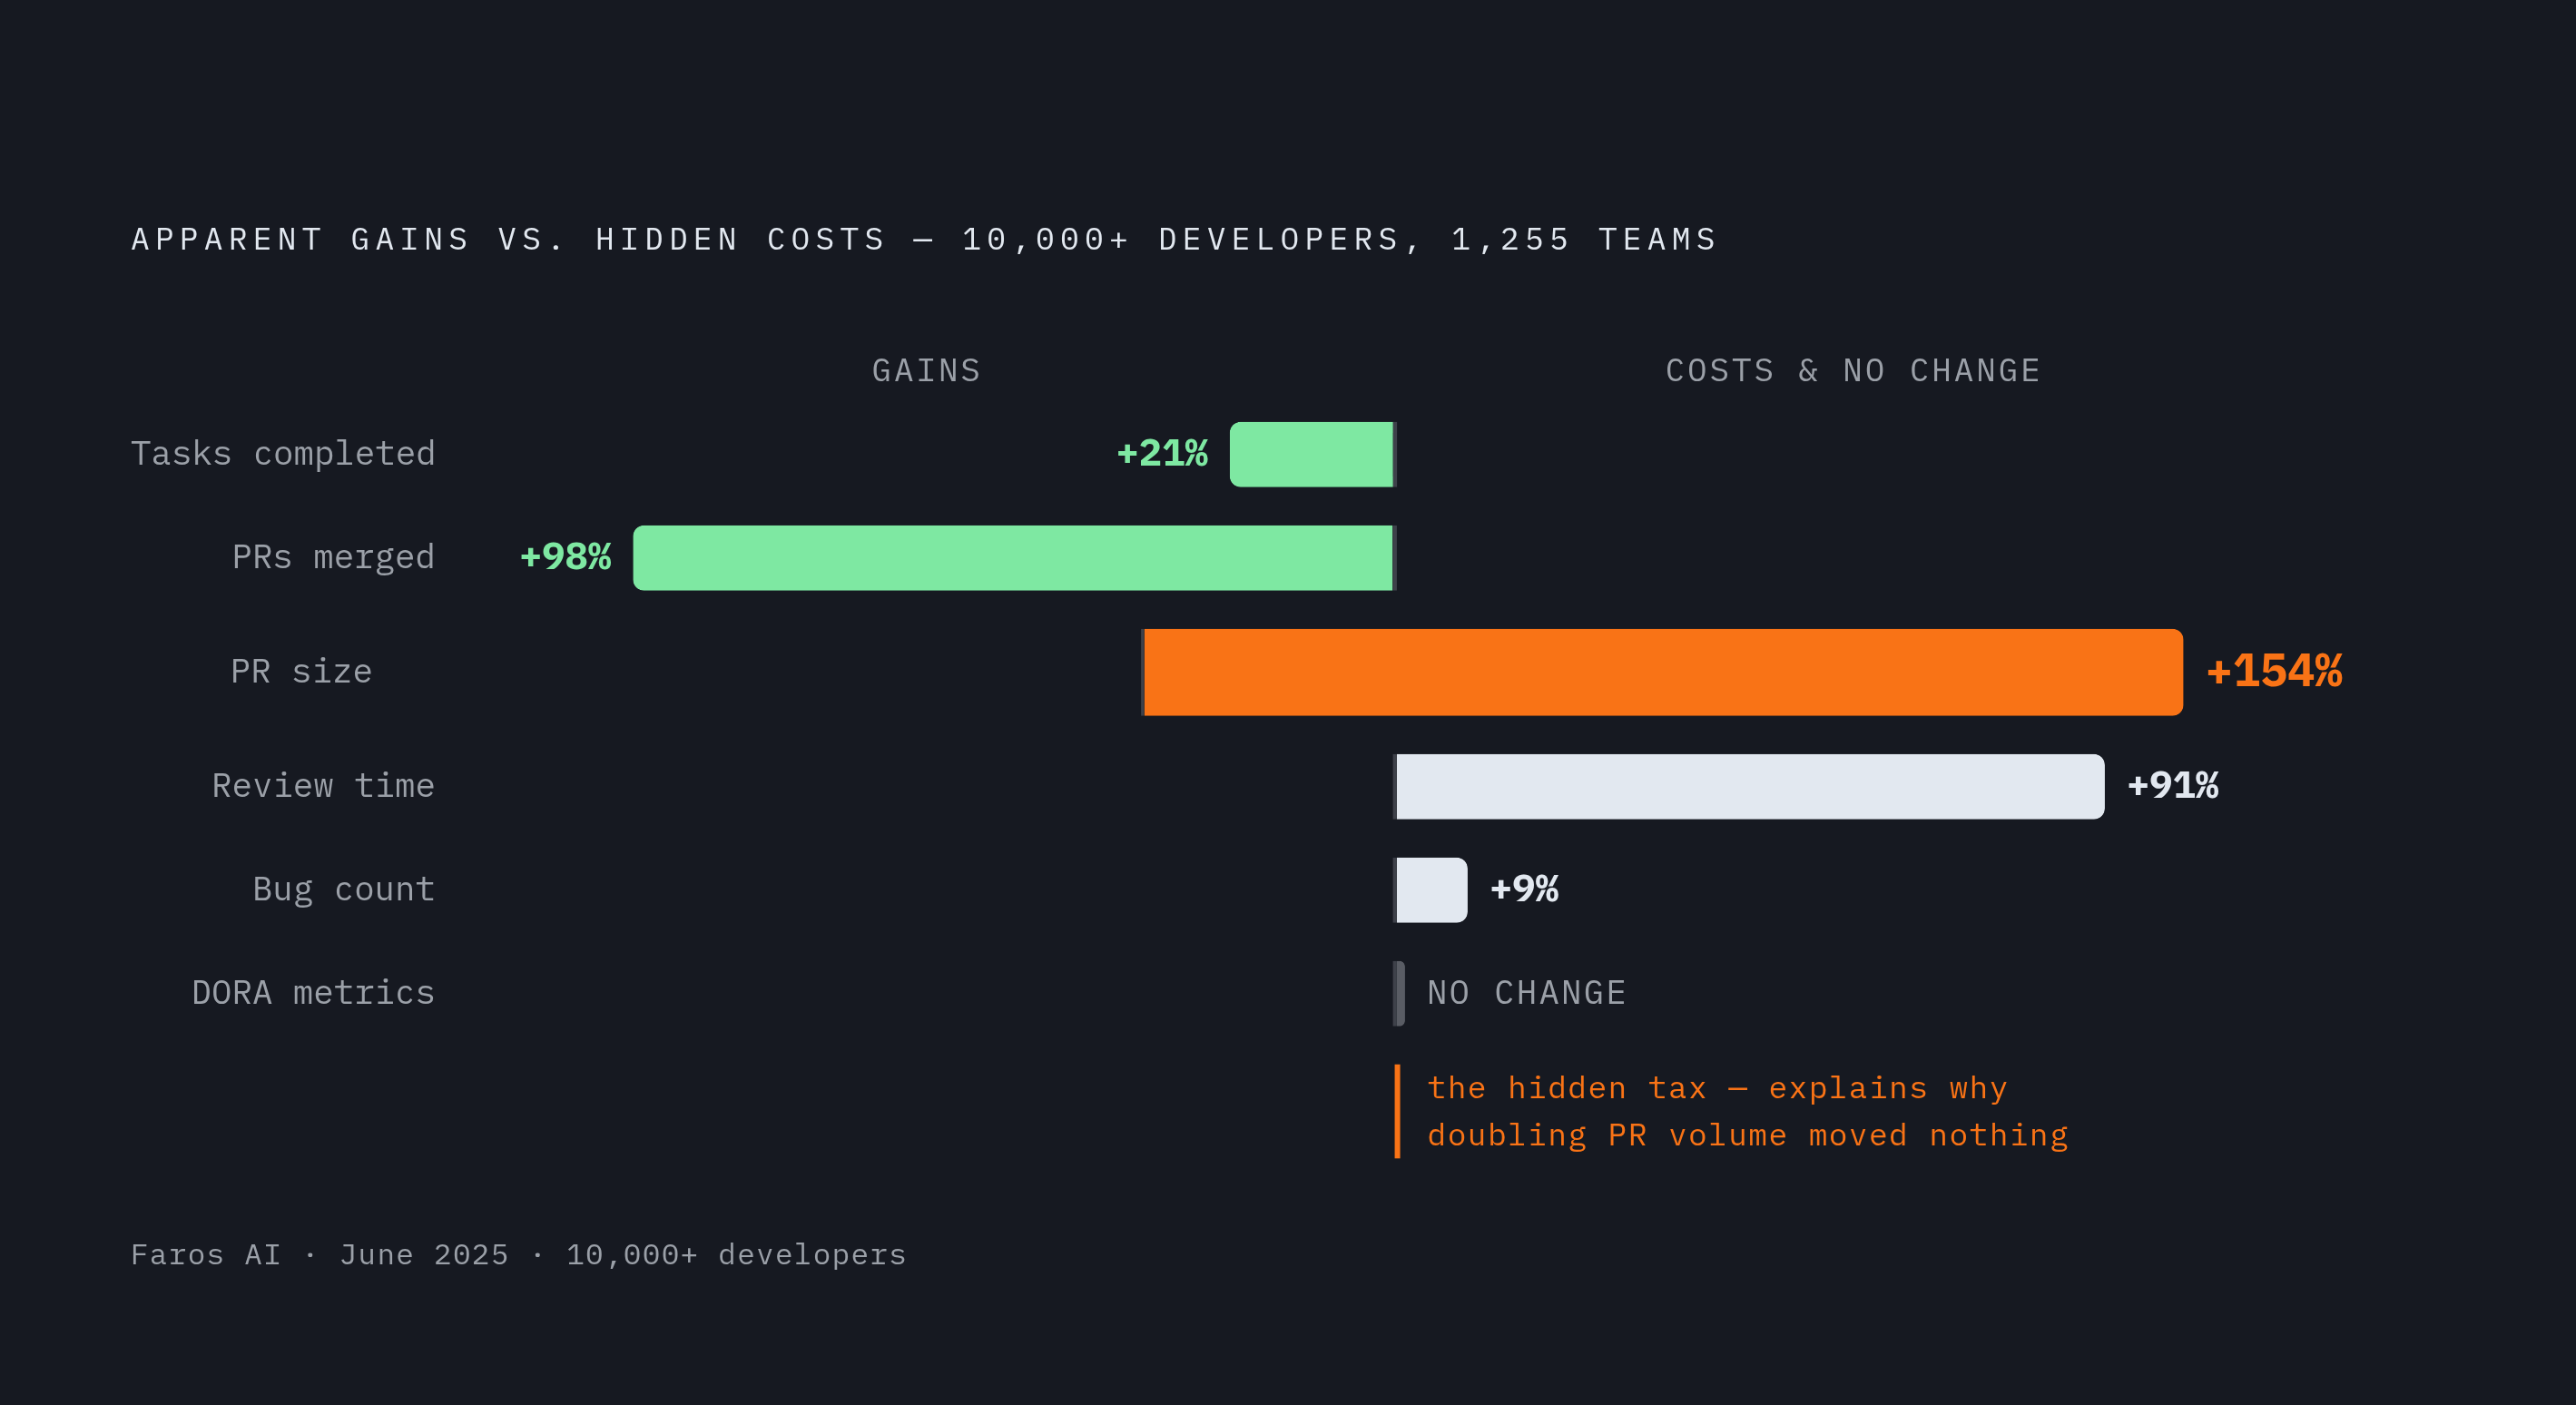
Sit with this study for a second. Faros AI looked at over 10,000 developers across 1,255 teams in June 2025. Teams with high AI adoption completed 21% more tasks. They merged 98% more pull requests. Sounds like a win, right?
Now the other half of the same data. PR size grew 154%. Review time went up 91%. Bug counts rose 9%. And the DORA metrics, the ones that track whether software actually ships and stays working, were flat. More pull requests, bigger pull requests, slower reviews, more bugs, and no real gain in throughput. That's not a productivity story. That's a bottleneck wearing a productivity costume.
It's also not just a measurement gap, it's a perception gap. A randomized controlled trial from METR found developers believed AI tools made them about 20% faster. Measured against a clock, they were actually 19% slower. Sit with that one too. The gap between what people feel and what actually happens isn't a rounding error, it's most of the story.
Why does this happen? Because writing code was never the whole pipeline. Review, testing, QA, all of that still moves at close to human speed. Speed up one stage and you just move the traffic jam somewhere else. GitClear's numbers back this up: code churn (code that gets rewritten shortly after it's written) sat around 3.3% in 2021 and climbed to 5.7-7.1% by 2024-2025. Code gets written fast and then rewritten fast. That's a strange kind of progress.
Put a number on the quality side too. 22% of merged code is AI-authored, and AI-coauthored pull requests show about 1.7 times more issues than the rest. Volume is going up. Quality is often going the other way. Those two lines shouldn't be moving in opposite directions, but they are.
Developers feel this even when the dashboard doesn't show it. Stack Overflow's 2025 Developer Survey found favorable views of AI tools dropped from 70% to 60% year over year. 46% of developers said they don't trust AI output. And the single biggest complaint, at 66%, was that AI answers are "almost right but not quite." That's about as precise a description of a quality problem as you'll get, and it's exactly the kind of thing a lines-of-code metric will rarely catch.
Which traditional metrics are salvageable and which need to be retired
Not every old metric deserves the trash can. Some just need to be pointed at the team instead of the individual.
Retire these:
- Lines of code. Rarely a great signal. Now actively misleading, since agents can churn out huge volumes of code that gets rewritten days later and doesn't stick.
- Individual commit frequency. Basically meaningless once an agent is committing on someone's behalf. Used to suggest a productive engineer. Now it might just mean a script is running on a loop.
- Story points completed, tracked per individual. Blends human thinking with agent output into one number, which hides more than it reveals.
Keep these, but change how you read them:
- PR merge rate. Still useful, but mostly at the team level, and only when paired with what happens to that code after it merges. On its own, the Faros numbers show exactly how this metric can lie to you.
- Cycle time. Still valid, but split it. How long do human-owned stages take versus agent-owned stages? Blend them together and you hide where the delay actually lives.
- The four DORA metrics (deployment frequency, lead time, change failure rate, time to restore). Built around outcomes rather than individual output, so they hold up better than most. But remember: DORA stayed flat in the Faros study while PR volume nearly doubled. Even a good metric can miss what's happening right underneath it.
The pattern is simple, once you see it. Any metric standing in for human effort tends to break once something non-human is doing the effort. Any metric tied to what the system actually delivers tends to keep working, because outcomes don't care who or what produced them.
Measuring what agents actually contribute: output quality, task completion, and autonomy rate
Agent effectiveness isn't developer productivity wearing a different hat. It needs its own numbers.
- Task completion rate. Of everything handed to the agent, how much gets finished without a human stepping in mid-task to fix something? Tells you whether the agent is being used inside its reliable range or well outside it.
- First-pass acceptance rate. How often does agent-written code get through review with no real changes? That's the line between an agent that's actually helping and one that's just generating volume someone else has to clean up after.
- Autonomy rate. What share of a task, start to finish, does the agent handle without a human coming back in? Track it over time and you'll see whether trust in the agents is growing or stuck in place.
- Post-merge defect rate, split by who wrote the code. Human-written? Human-edited AI output? Fully agent-generated? Given that 1.7x issue rate on AI-coauthored PRs, this split isn't optional. It's most of the point.
- Churn on agent-generated files, specifically. GitClear's rising churn numbers suggest this will surface problems faster than looking at churn in aggregate ever would.
One reality check worth building in early: frontier AI models differ meaningfully from each other on standard coding benchmarks like SWE-bench Verified. Calibrate your expectations against the model you're actually running, not against some imagined ideal of what AI can do.
None of this works without tagging. Agent-generated work needs to be marked at the commit or PR level from day one. Teams that skip this step now may find, later, that they can't answer basic questions about agent ROI, simply because the data was never captured.
Measuring human decision quality: what engineers are doing when agents handle execution
If the agent is writing the code, the engineer's job shifts underneath them. It becomes: scope the task right, decide how much freedom to give the agent, check the output with a critical eye, and catch mistakes before they hit production.
The DX Q4 2025 impact report found an average of 3.6 hours saved per developer per week. Fine, good. The real question is what happens to those hours once they're freed up.
A few ways to check:
- Review thoroughness. Are reviewers catching that elevated 1.7x issue rate on AI-written PRs, or are they skimming and rubber-stamping because the volume is high? Track defect escape rate against time actually spent in review.
- Task decomposition quality. How well are engineers breaking work down before handing it to an agent? Bad scoping is one of the biggest reasons agents stall out partway through and need a human to step back in. Track how often tasks get restarted.
- Prompt and rules file iteration. Teams that put real effort into the instructions they give their agents, rules files, context documents, structured prompts, tend to see returns that build over time. Version-control these the same way you'd version-control code, and track how they change.
Here's a wrinkle worth naming plainly: a field study across thousands of developers found that developers with above-median tenure showed little meaningful productivity gain from AI tools. The likely explanation: senior engineers are spending their reclaimed time on review and correction, work that rarely shows up as output on any dashboard.
Which is exactly why satisfaction surveys and cognitive load checks matter more now, not less. In controlled GitHub experiments, 87% of developers said AI assistance took less mental effort. That's a real finding. But it needs to be checked against actual defect numbers, not waved around as proof of productivity all by itself.
One more worth tracking: human-in-the-loop rate. For the code paths where a mistake is expensive (security, data integrity, core business logic), track how often engineers are actually reviewing versus just deferring to whatever the agent produced. Call it a governance question as much as a productivity one, because it is both.
Rebuilding team-level and system-level measurement around outcomes
The unit you're measuring has to move. Not the individual, not primarily. The team, plus whatever agents that team runs, as one combined system. Capacity now equals human judgment plus agent execution, added together.
A few metrics that hold up under this shift:
- Feature delivery rate. Working features shipped per week or month, full stop, regardless of who or what wrote the code. This matters precisely because of what Faros found: DORA stayed flat while PR volume nearly doubled. Without an outcome anchor, every intermediate metric can quietly mislead you.
- Change failure rate, split by code origin. Track failures from agent-generated code separately from human-written code. Direct signal, way less guesswork.
- Review-to-merge latency. Review time rose 91% in the Faros study. Track this as a pipeline health check, and dig into whether that rise means better scrutiny or just review fatigue setting in.
- Defect escape rate, by stage. How many bugs get caught by tests (many now written by agents), how many by human review, how many make it all the way to production? If the escape rate climbs after review, that's review quality buckling under volume.
Cost matters too. As pricing across the major AI platforms shifts toward metered, usage-based billing, cost per delivered feature turns into something you can actually track, not just estimate. That turns agent ROI into a dollar figure instead of a vague sense that things feel faster.
Keep the qualitative side alive as well: developer experience surveys, checking whether trust in agent output is calibrated (not blind faith, not stubborn refusal to use it), and retrospectives comparing agent-assisted features against fully human-built ones.
The goal is a dashboard with three layers: what the agents produced, what the humans decided, and what the system actually delivered. Miss any one of the three and you're flying with an instrument out.
How to roll out a new measurement framework without creating measurement theater
Here's the trap: bolting new metrics on top of the old ones. Now everyone's filling out more reports, eating up the exact time the agents were supposed to free up. That's not progress. That's just busywork wearing a new costume.
A few rules for doing this without shooting yourself in the foot:
- Retire before you add. Kill or downgrade the dead metrics first: lines of code, individual commit counts, raw story-point velocity. Don't stack new signal on top of old noise.
- Tag at the source. Mark agent-generated work automatically at the commit or PR level. Manual tagging rarely survives contact with real scale, and without tagging, most of the agent-specific metrics above simply can't be computed.
- Treat rules files and prompts as real engineering work. Version-control them. Review them. Improve them on purpose, over time. Teams that do this build a feedback loop. Teams that skip it are treating live infrastructure like it doesn't exist.
- Match the cadence to the metric. Fast-feedback numbers, task completion rate, first-pass acceptance, belong in weekly reviews. Slower-moving signals, defect escape rate by code origin, feature delivery rate, need a longer window, monthly or quarterly, to separate real signal from noise.
- Don't let any single number become a target. The moment a metric becomes a target, people start optimizing the number instead of the thing it was supposed to represent. Pair volume metrics with quality metrics so they check each other, and keep a qualitative channel open next to the numbers.
At real scale, tens of thousands of engineers, even a simple, consistent tagging convention across every team pays off enormously. The tooling work upfront is small next to the visibility it buys across the whole organization.
What a well-measured AI-augmented team actually looks like
Picture a team running agents on tests, migrations, and routine feature work, which frees engineers to spend their time on architecture and the tricky edge cases agents tend to miss. Their dashboard shows agent task completion rate, first-pass acceptance rate, change failure rate split by code origin, and cycle time broken out stage by stage.
Here's what that team knows that a traditionally-measured team usually doesn't: which bugs trace back to agent-written code, how much review time that code actually costs, what each delivered feature costs in agent usage, and whether trust in the agents is holding steady or starting to drift.
Go back to that DX number: 3.6 hours saved per developer per week, with daily AI users merging roughly 60% more pull requests. That's real capacity, no question. Whether it turns into anything depends almost entirely on whether a team can see where that capacity actually goes. That's most of the job the measurement framework above is trying to do.
The principle underneath all of it: measurement should follow the value. When agents take over execution, value moves toward human judgment and system-level outcomes. So that's where the measuring needs to happen now.
This isn't a someday problem. a large majority of developers already use AI tools on a regular basis. The measurement gap is happening right now, with real consequences happening right now. Teams that fix how they measure aren't just getting a clearer picture of their own work. They're building the feedback loop that lets them get better at using agents, catch quality problems early, and back the next round of investment with evidence instead of a good feeling.