Using an AI Debugger Inside the IDE
AI agents need direct access to the debugger, not just chat suggestions, to actually fix bugs.
This piece is about giving AI agents access to the debugger itself, not just the chat panel. Bug-fixing is one of the most common jobs developers hand off to AI agents, and it's also one of the least automated in practice. Most workflows still run through a human relay: paste the error, get a suggestion, apply it, repeat. The bigger shift is letting the agent run that loop itself, inside the IDE, using the same tools a developer would.
Why AI agents have mostly ignored the debugger until now
Debuggers were built for people. Setting a breakpoint, stepping through a stack, checking a variable at exactly the right moment: that's a human at a keyboard, one careful command at a time. It's a bad fit for a model that wants to send a request and get a clean answer back.
Two things make command-line debuggers like PDB, JDB, and GDB especially hostile to agents.
First, verbosity. These tools spit out text meant for a human eye scanning line by line, not machine-structured output a model can parse cleanly. Second, asynchrony. Breakpoints fire on runtime events, and timing shifts depending on what's happening when the debugger stops. Hard to script, harder to hand to a model expecting a predictable back-and-forth.
So agents found workarounds instead of solving the actual problem. Static analysis: read the code, reason about it, rarely run it. Iterative test-fix cycles: guess a fix, run the tests, read the failure, guess again. Trial and error with an LLM doing the guessing.
Both approaches skip something a developer would rarely skip: watching the program actually fail. Variable state at the moment of the crash. Call stack depth. What's sitting in the heap. That information mostly only exists once you run the code under a debugger and watch it happen.
Microsoft Research put a name to this gap in February 2026, describing agents as "currently deprived" of runtime information "due to design limitations." Not a capability problem. A plumbing problem. The models weren't the bottleneck.
What the Debug2Fix research reveals about giving agents real runtime access
Microsoft Research's Debug2Fix, also from February 2026, is one of the first systematic attempts to build interactive debugging into a coding agent as a core piece of the architecture, not a feature bolted on afterward.
The structure explains why it works when other attempts stalled. A main agent handles the high-level task: understand the bug, decide on a fix, coordinate the process. A dedicated debugging subagent handles the messy, stateful, asynchronous work of actually talking to the debugger (JDB for Java, PDB for Python), translating between what the main agent wants to know and what the debugger's clunky interface gives back.
Here's the detail that matters most. When the research team exposed debugging tools directly to the main agent, they mostly sat unused. The model rarely reached for them. Only once that low-level interface got wrapped in a purpose-built subagent did the capability actually get used. A small architectural choice, a big consequence, and one worth watching for in any agentic IDE going forward.
On benchmarks like GitBug-Java and SWE-Bench-Live, Debug2Fix beat vanilla agents by more than 20% relative to baseline in some cases. That lines up with the diagnosis: the bottleneck wasn't smarter models, it was giving the model a usable way to reach the debugger at all.
This didn't come from nowhere. AutoSD paired LLM-generated hypotheses with debugger interaction. ChatDBG built an LLM into the debugger for human-guided dialogue. Both pointed in this direction, but both still needed a human steering the conversation. Debug2Fix is one of the first largely autonomous versions of that loop.
What an agentic debugging workflow actually looks like step by step
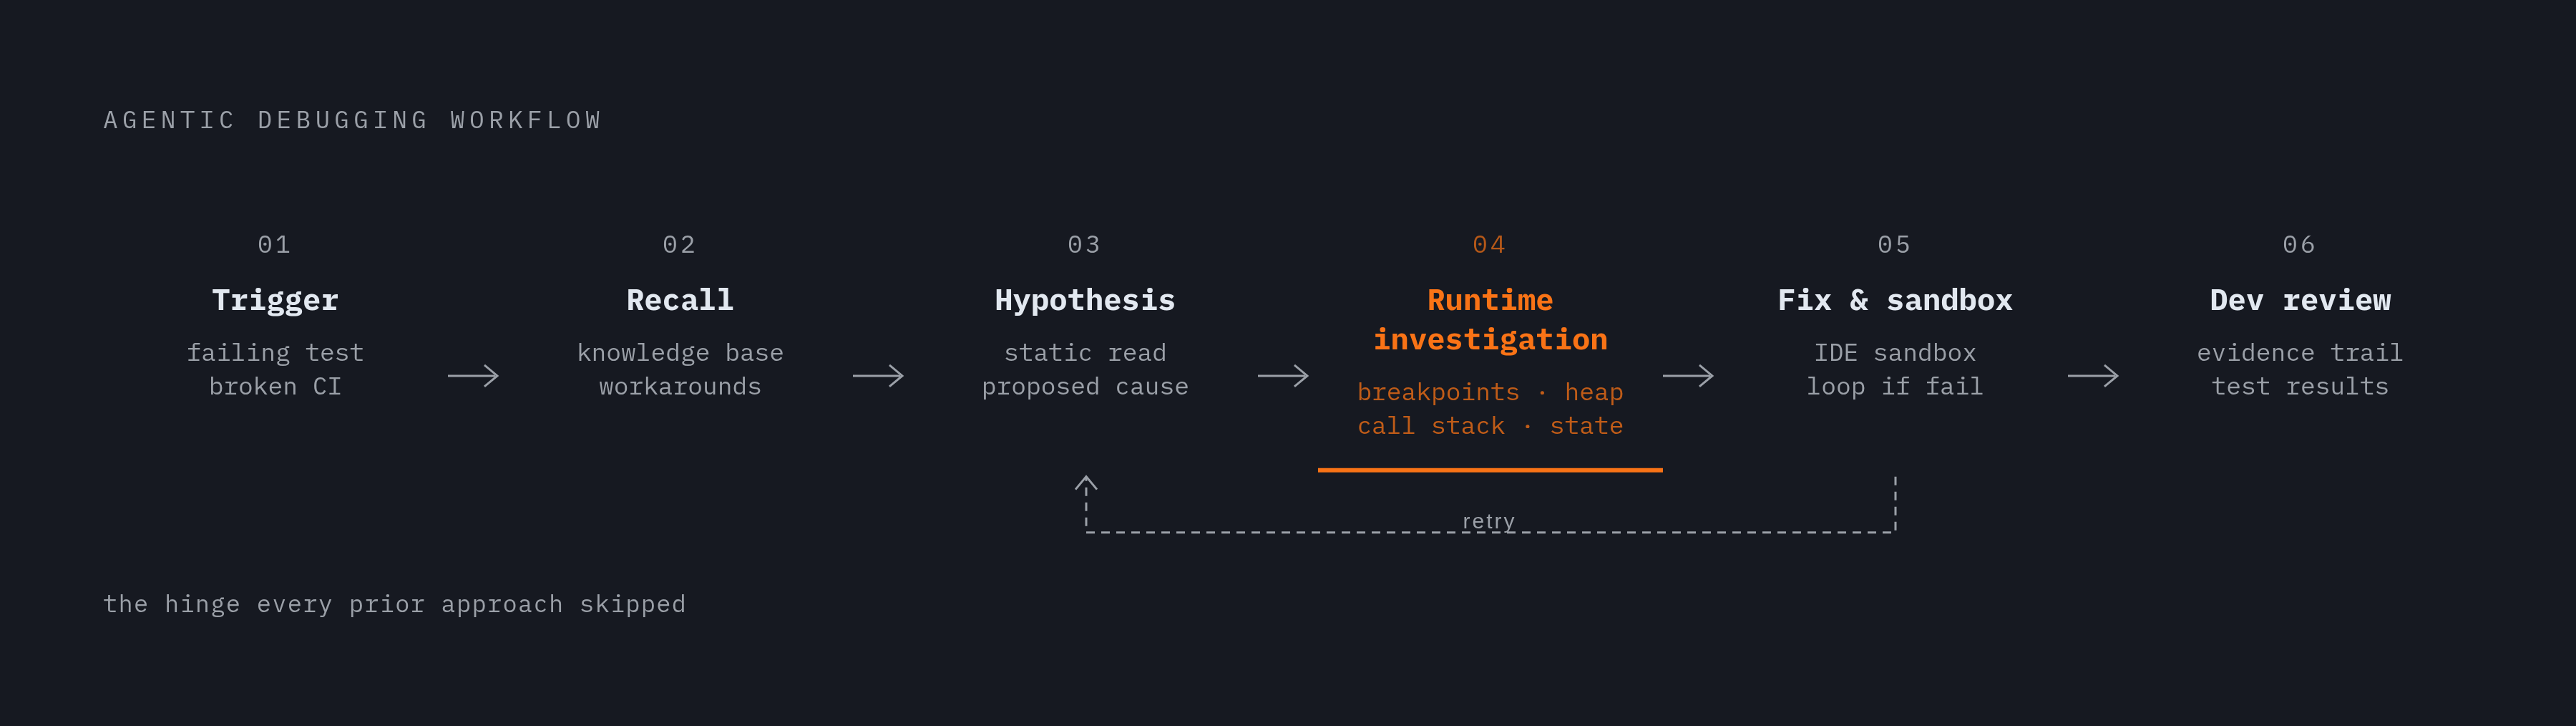
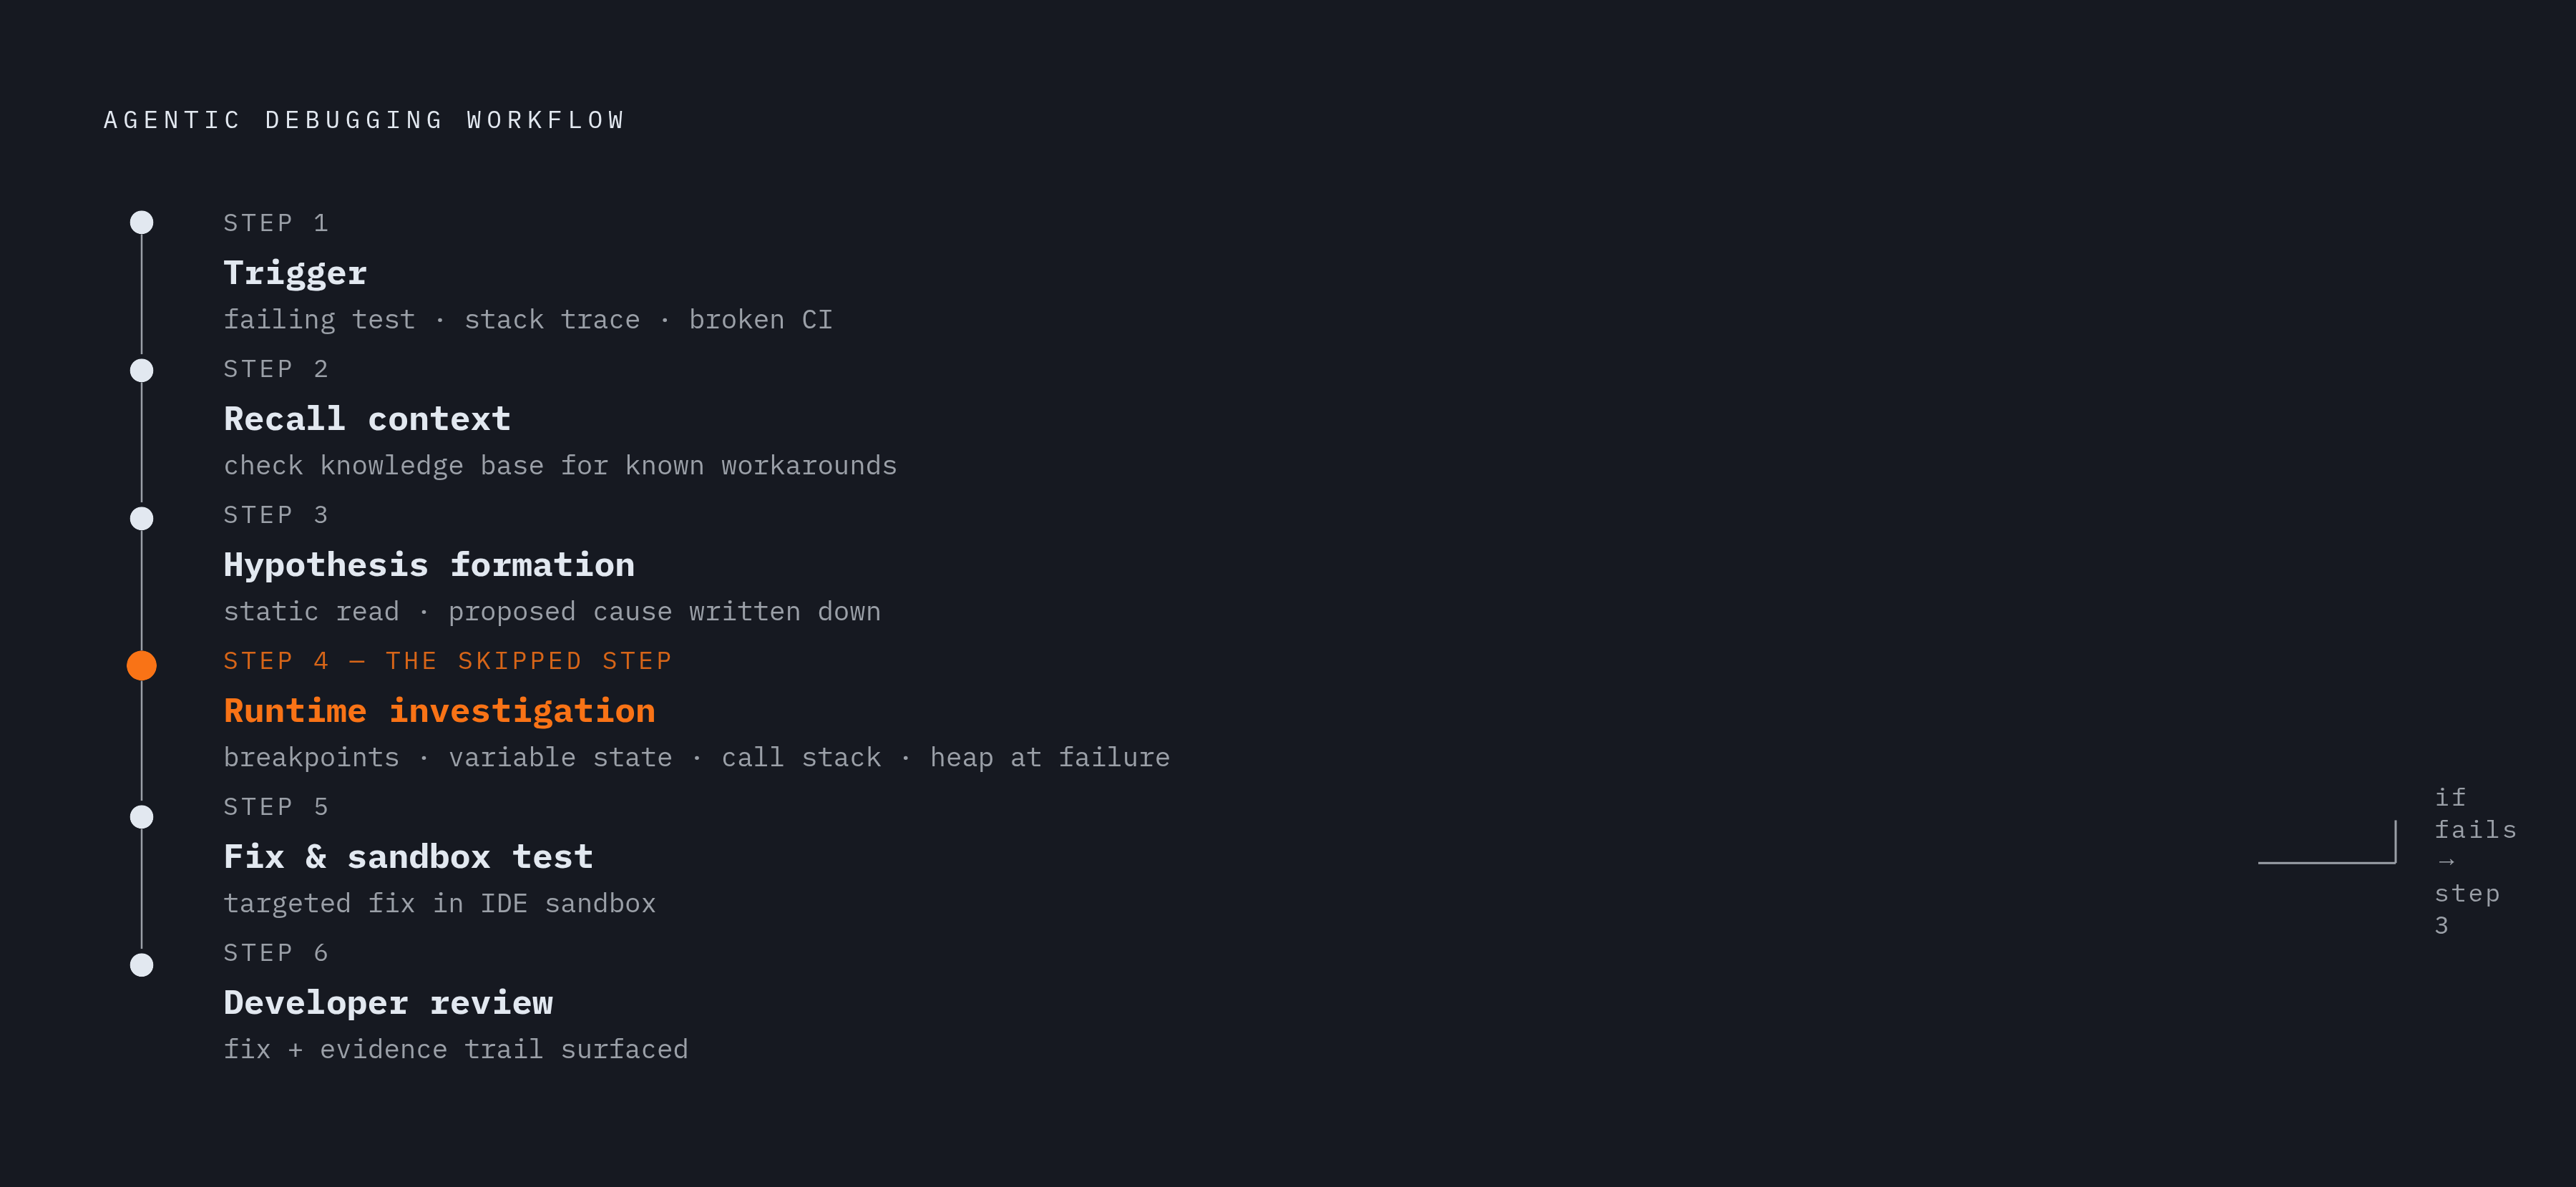
Break it into steps and the shape gets clear.
Step 1: Trigger. The agent needs a real signal, not a vague complaint. A failing test, a stack trace, a broken CI run. A developer can hand this off directly, or the agent catches it on its own in a background session.
Step 2: Recall context. If the project has a long-term knowledge base, the agent checks whether the thing it's about to change is actually an intentional workaround. Skip this step and you get agents "fixing" things that weren't broken.
Step 3: Hypothesis formation. Before touching the debugger, the agent does a static read of the stack trace and the relevant code paths, then proposes a likely cause. Written down, not a black box. You can read it and disagree before anything runs.
Step 4: Runtime investigation. This is the step static analysis and blind test-fix loops skip, and it's the one that matters most. The debugging subagent sets breakpoints at the hypothesized failure point, runs the failing test under the debugger, and reads the actual variable state, call stack, and heap contents at the moment things go wrong. The hypothesis gets confirmed or revised based on what actually happened at runtime, not what the test output implied.
Step 5: Fix and sandbox test. With a confirmed cause in hand, the agent writes a targeted fix and runs it in a sandbox inside the IDE. If it fails, the loop goes back to Step 3, now with new information loaded.
Step 6: Developer review. The agent surfaces the fix along with the evidence trail: what the debugger actually showed, and the test results. You accept, tweak, or reject it.
One thing this is not: the pattern sometimes called "AutoFixer," where the agent writes code, runs it, sees it fail, tweaks, repeats until tests pass. That loop skips Step 4 entirely. A fix that comes out of it might work. You just won't know why, and that's a different kind of confidence than a fix backed by an evidence trail.
How to configure the IDE environment so the agent can actually run this loop
None of this happens by default. The agent needs permission to run the debugger, execute tests, and write files, scoped sensibly, and most IDEs leave that configuration to you.
Check these before handing off a bug:
- Debugger attachment. Can the agent (or its subagent) actually attach to the runtime? PDB for Python, JDB for Java, Chrome DevTools Protocol for JS. Has to be configured, doesn't happen on its own.
- Test runner integration. The agent needs to run one failing test, not the whole suite every cycle. That's the difference between a fast loop and a slow, expensive one.
- Sandbox boundaries. Decide what the agent can write, and where. Local Docker containers or CI sandboxes, not your working branch.
- Context and memory. A project-level rules file or knowledge base means the agent shows up already knowing the architectural decisions and known workarounds, instead of rediscovering them mid-debug.
Then there's the autonomy question, and you should answer it before the session starts, not during it. Supervised mode: the agent proposes each step, you approve before it runs. Autonomous mode: the agent runs the whole loop and shows up with a finished fix.
Neither wins in every case. A shared production codebase wants more supervision. An isolated feature branch can handle more independence.
And watch for the boring failure modes: file permission issues, test runner timeouts, a missing debugger adapter, a context window missing the one file that actually mattered. Nothing exotic. This is usually why a promising setup quietly stalls.
Writing the handoff that gets the agent to the right failure fast
What you hand the agent shapes everything after it. Say "this is broken" and you get a wide, unfocused static search. Give a precise failure signal and the agent goes straight to runtime investigation.
A good handoff includes the exact failing test or reproducer, not a description of the symptom. The full stack trace, not a screenshot, not a paraphrase. Expected versus observed behavior, stated plainly. And recent changes that might be relevant; the agent can dig through git history itself, but pointing it there saves a step.
Here's the part that trips people up: consider withholding your own theory of what caused it. Let the agent form its own hypothesis from the evidence, then push back if you disagree. A wrong guess from the developer, planted early, can anchor the whole session to the wrong path.
Scoping matters as much as writing it well. A bug in an isolated module with a clean reproducer is a strong first agentic debugging task. A race condition in a distributed system that fails non-deterministically is a bad one. Know which side of that line you're on before you hand it off.
If your IDE supports a persistent rules file, load it before the handoff. Give the agent that context up front, so it's less likely to rediscover, mid-debug, that some module is intentionally stateless.
Where agentic debugging fits into the broader CI and review workflow
This loop doesn't need a human to kick it off every time. Wire it into CI, and a failing build triggers the agent's investigation on its own. It picks up the failure, runs the debug loop in a sandbox, and opens a draft PR with the fix and the evidence trail attached. What lands in front of the developer isn't a raw failure notification. It's a proposed fix with a reasoning log behind it.
This extends past the IDE window too. Agents that pick up a CI failure notification in Slack, investigate in a cloned environment, and post findings back are already something teams run, without anyone opening an editor.
There's a throughput story behind this. A report covering more than 135,000 developers found that daily AI tool users merge roughly 60% more pull requests than light users. Faster, more autonomous debugging is part of what drives that number.
But here's the catch: fixing the bug faster doesn't automatically make delivery faster. If code review, CI/CD, and QA don't move at the same speed, the agent's speed doesn't show up anywhere that matters. An agent that fixes a bug in three minutes, followed by a two-day review queue, is a rounding error on how fast the team ships. Adopt agentic debugging at the IDE level without touching the review process around it, and the gain pools at one stage while the rest of the pipeline stays exactly as slow as before.
Choosing an agentic IDE that can actually run this workflow today
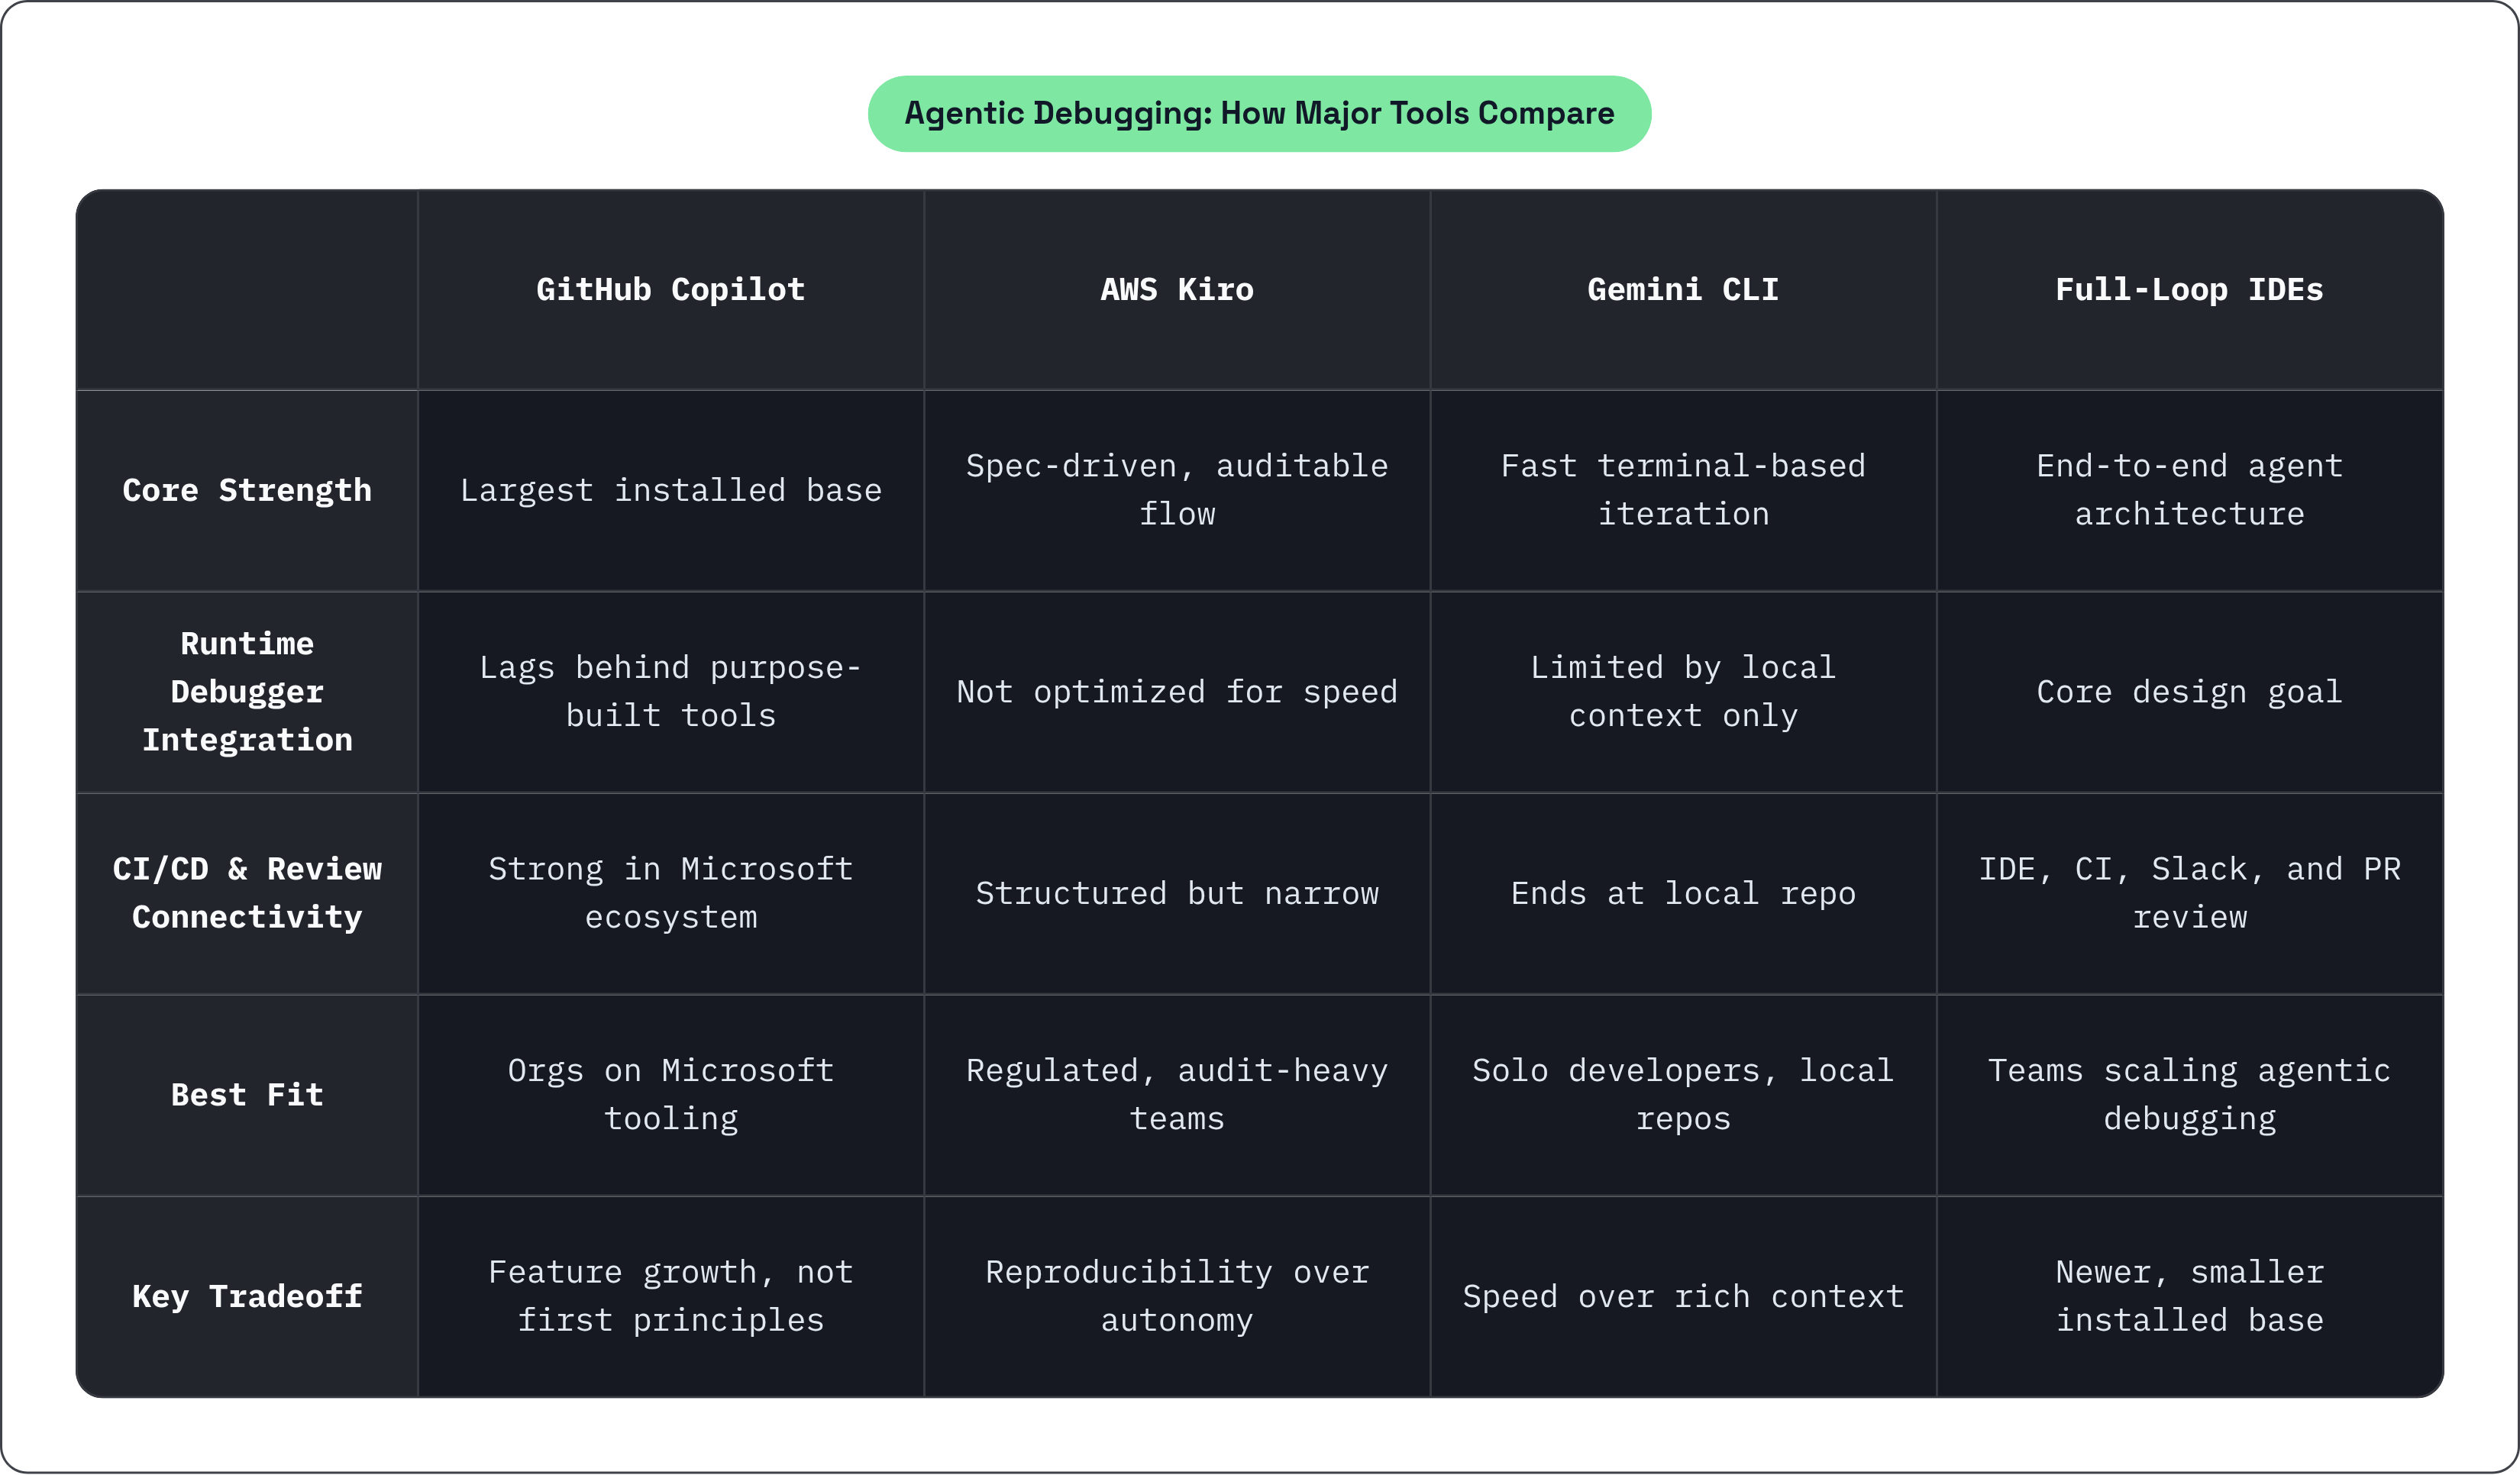
Not every tool that markets itself as "AI-assisted" can run this loop. There's a real gap between an editor that offers smart suggestions and one where an agent can attach to a runtime, run tests, and iterate without a human relaying each step.
Ask these before you commit a team to a tool. Can the agent attach to the actual language runtime, or is it only reading code statically? Does it use a subagent or tool-use architecture, so the debugger is a real capability rather than a demo feature? Can it run tests, read results, and iterate largely on its own? Does it connect to CI/CD, GitHub PR review, and Slack, or does its world end at the editor window? Does it give you supervised and autonomous modes both, so you decide how much rope the agent gets on a given task?
As of mid-2026, the field splits into a few camps. Some environments are built for the full loop: IDE, terminal, CI, Slack, and GitHub PR review, all connected, agents running in parallel across long sessions. This is the category worth evaluating seriously if you want to run agentic debugging at scale. Some early enterprise adopters are already operating at that level.
GitHub Copilot has the largest installed base by far, especially inside organizations already built around Microsoft's tooling. Its agent and workspace features have grown up a lot, though its runtime debugger integration specifically still lags behind tools built around that as the core design goal.
AWS Kiro takes a structured, spec-driven approach, forcing documentation and reproducibility as it goes. Real advantage if you need auditable agent behavior. Not tuned for the fastest possible autonomous debug loop, though.
Gemini CLI has a following among developers who like operating in agent mode from the terminal. Effective for iterative debugging on a local repo without IDE overhead, but that speed trades away the deep, unified context that makes runtime debugging richer.
One more thing to check: the strongest agentic debugging setups aren't locked to a single model. A frontier reasoning model suits hypothesis formation. A faster, cheaper model is often plenty for the repeated grind of test-fix iterations. Being able to pick the right one for the job, instead of being stuck with whatever one provider ships, matters more here than it looks at first glance.
Right now, available data suggests only around 13.1% of professional developers use AI agents beyond basic autocomplete. Small group. But it's the group figuring this out first, and evaluating tools now, before this becomes the obvious default, is how a team gets ahead instead of catching up later.
Calibrating how much autonomy to give the agent as debugging complexity grows
There's no fixed dial here. The right amount of autonomy depends on what's actually broken.
A clean, isolated bug with a reliable reproducer, in a module nobody else is touching: fine candidate for letting the agent run the whole loop and just show up with a fix. Push it into a shared, high-traffic service, and the math changes. Supervision earns its keep exactly where a wrong fix is expensive and hard to undo.
Here's one way to think about it: autonomy should track confidence, not convenience. It's tempting to hand an agent full control because the loop is fast and the fix looks plausible. But plausible isn't verified. The whole point of the runtime evidence trail from Step 4 is that it gives you something to check before you trust the result. As the bugs get messier and the blast radius of a wrong guess gets bigger, that evidence trail is what should decide how much rope the agent gets. Not habit. Not how well the last five bugs went.